Dashboard
When you log into your Arcturus account for the first time you will be asked if you would like to take a tour of the Welcome screen. Click Start to begin, Skip Once to be reminded next visit, or Skip Forever to hide the tour.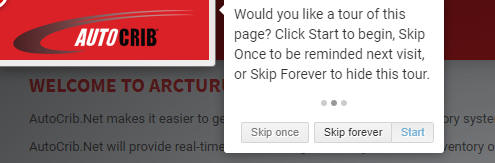
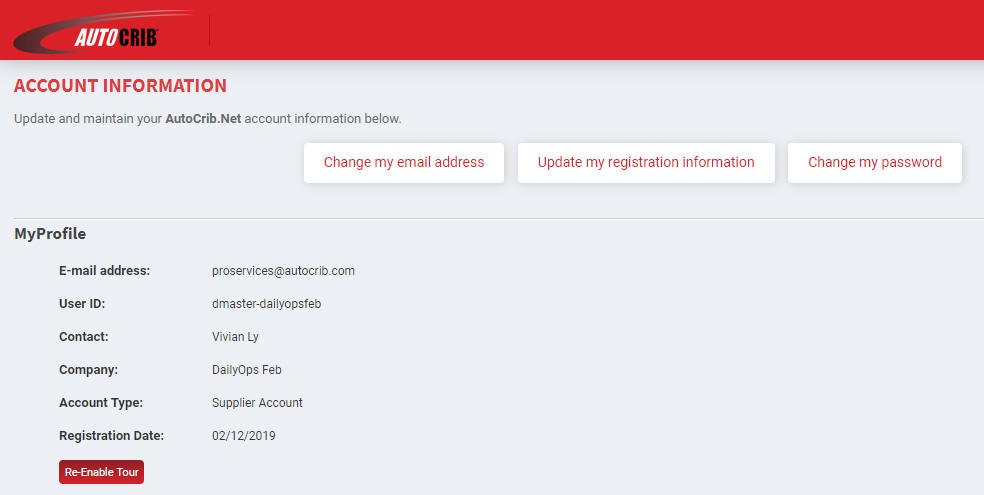
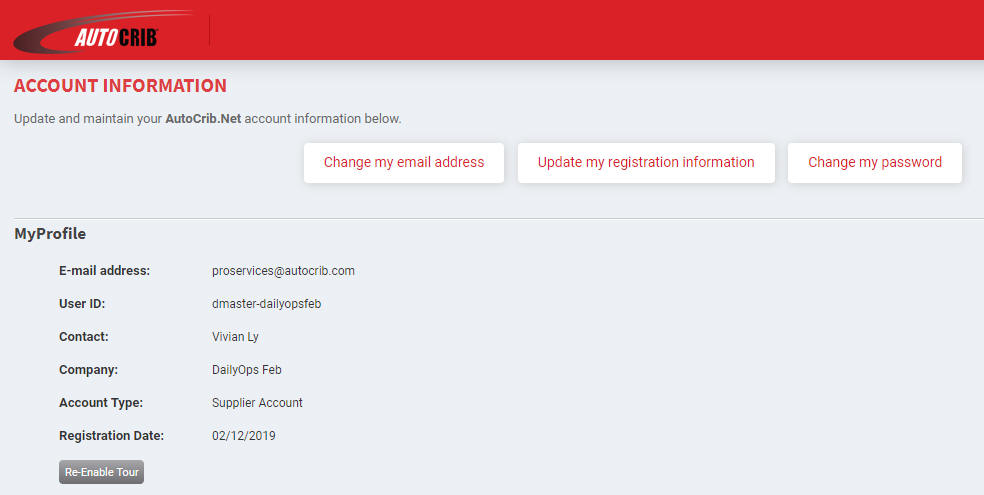
Please note that you may re-enable the tour prompt at any time by clicking On Profile and selecting the Re-Enable Tour button.
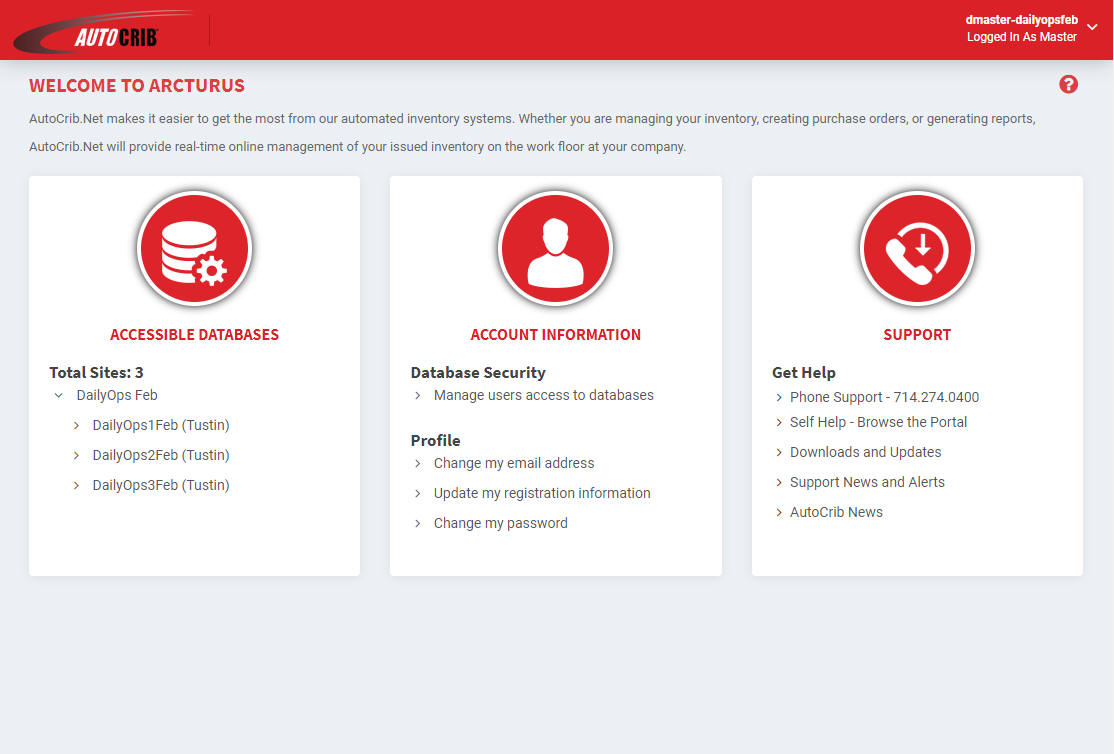
The WELCOME TO ARCTURUS screen is divided into the following three sections:
ACCESSIBLE DATABASES - The accessible databases section displays the total number of accessible sites and provides a link to access each one of those sites. To access a site click on the site name, you will then be directed to the site's Dashboard screen and all software menu options will be displays on the left hand side of the page.
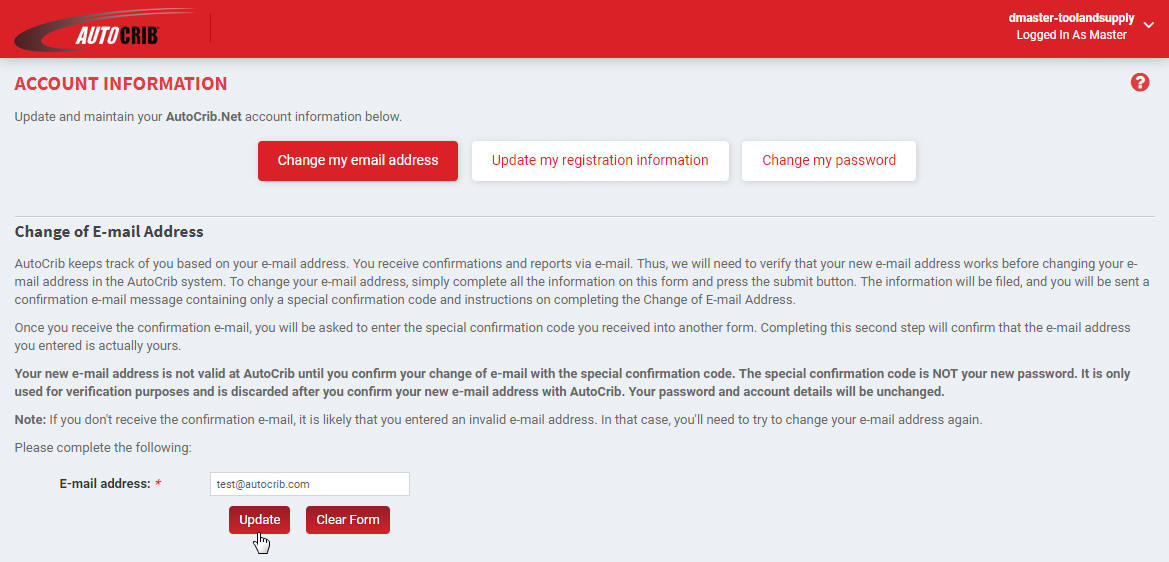
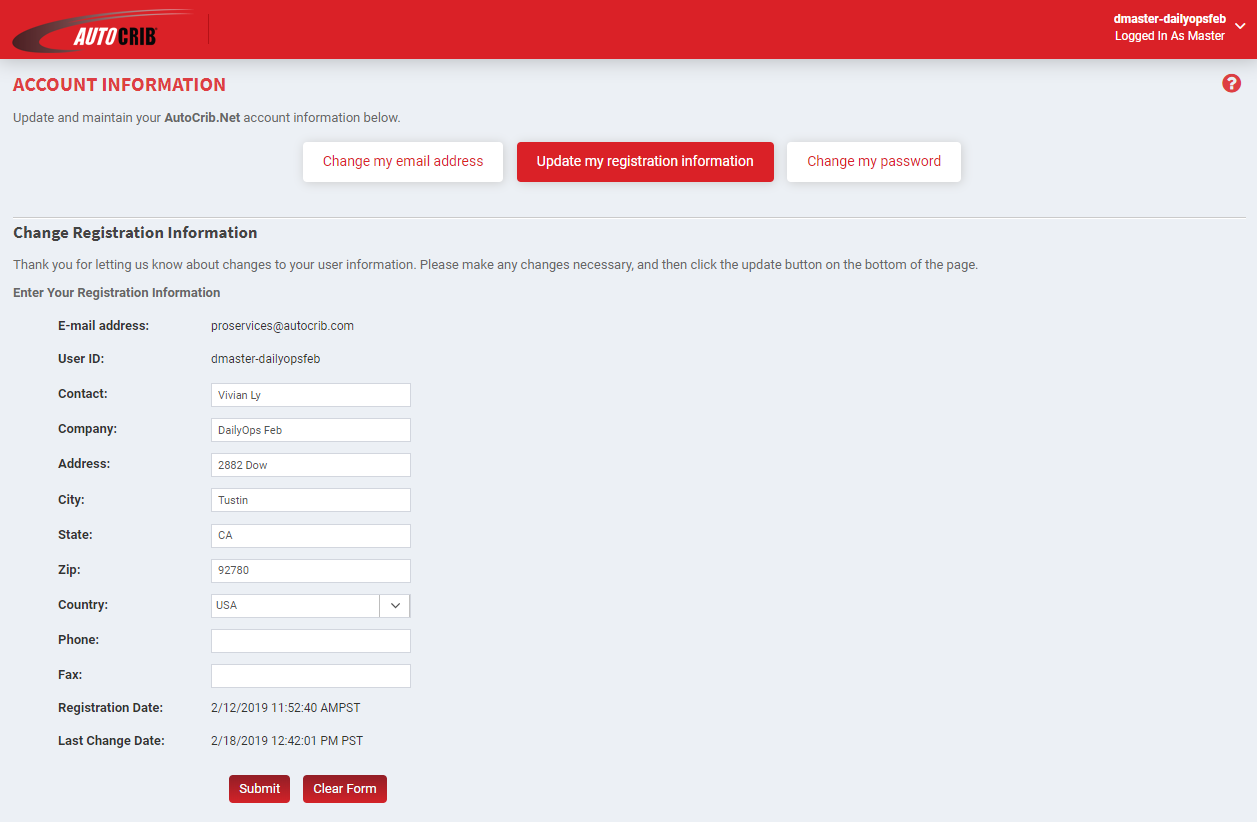
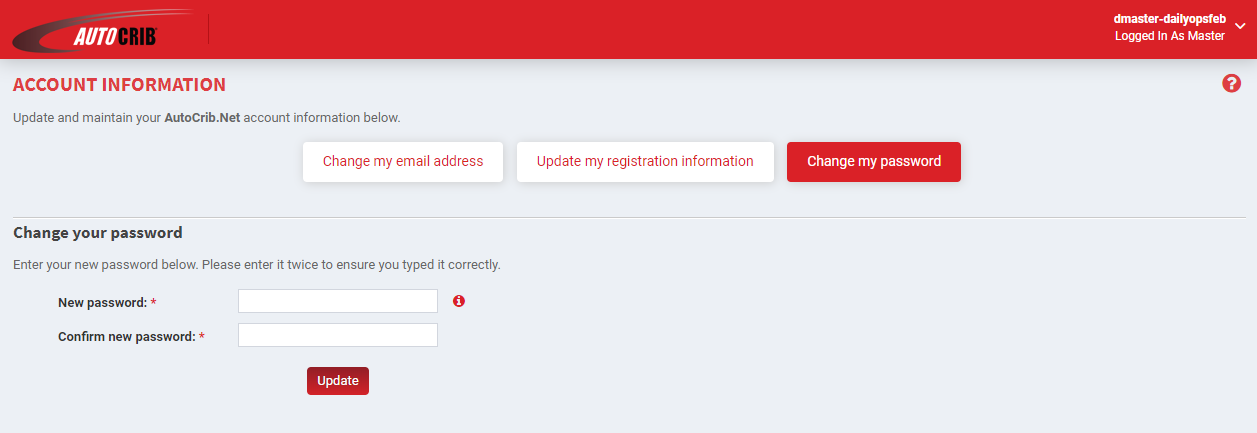
ACCOUNT INFORMATION - The account information section allows you to add, edit, or delete super admin users, and manage which databases (sites) they may or may not have access to. You can also access the account information screen where you may change your email address, update registration information, or change your password.
SUPPORT - The support section includes the AutoCrib Technical Support phone number, as well as various links to the AutoCrib Support Portal. You may browse the AutoCrib support portal for AutoCrib manuals, quick guides, how to guides, and troubleshooting guides. You may also download software updates, subscribe to technical support news and alerts, AutoCrib news, and create a technical support case.
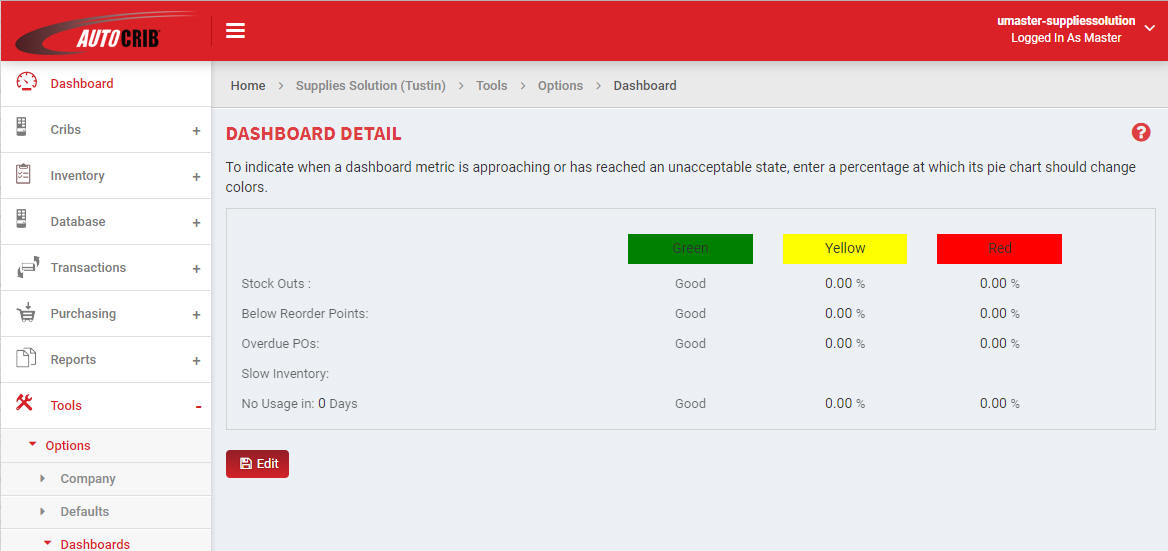
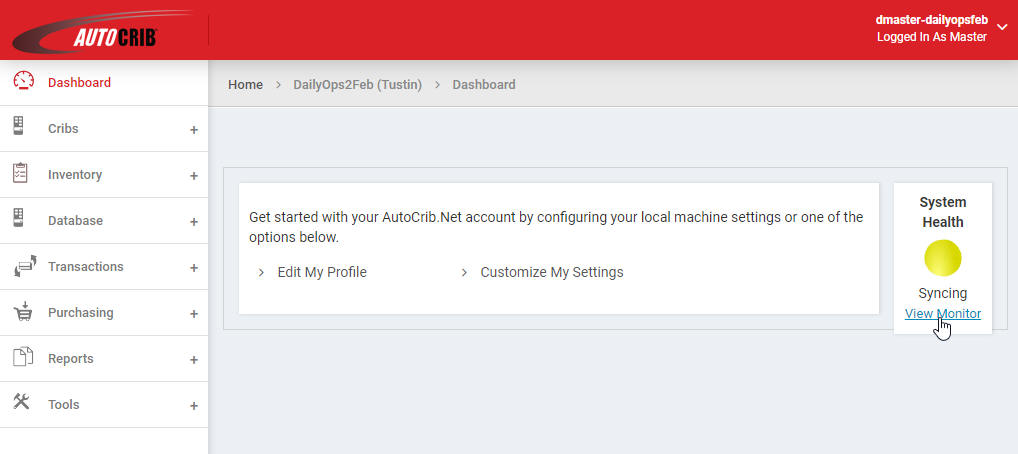
Dashboard Screen
From the Dashboard screen you may Edit your Profile by selecting the Edit My Profile link, or customize your settings by selecting the Customize My Settings link. You also have access to the System Health Syncing Monitor. If the System Health is Yellow, this means that there is a machine or several machines that are currently having a problem syncing. A red System Health indicates that all machines are currently NOT syncing. A green System Health indicates that all machines are currently syncing successfully. To access the Syncing Monitor click the View Monitor link:
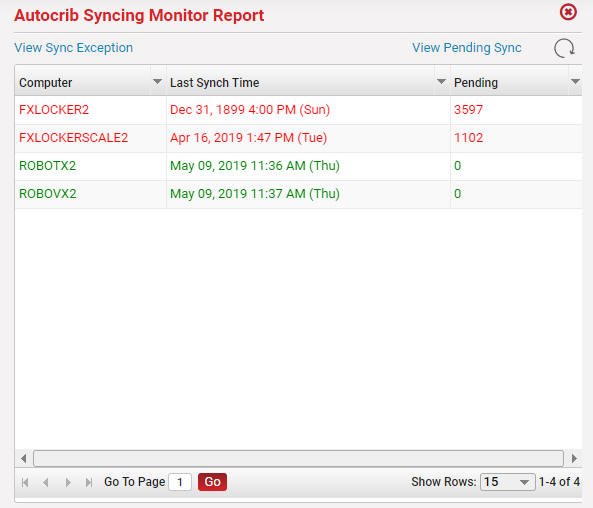
The Autocrib Syncing Monitor Report pop up will appear. The report will show you the Syncing Computer Name, Last Synch Time, and the number of Pending records. The Lines showing up in red are not syncing, and lines showing up in green are syncing:
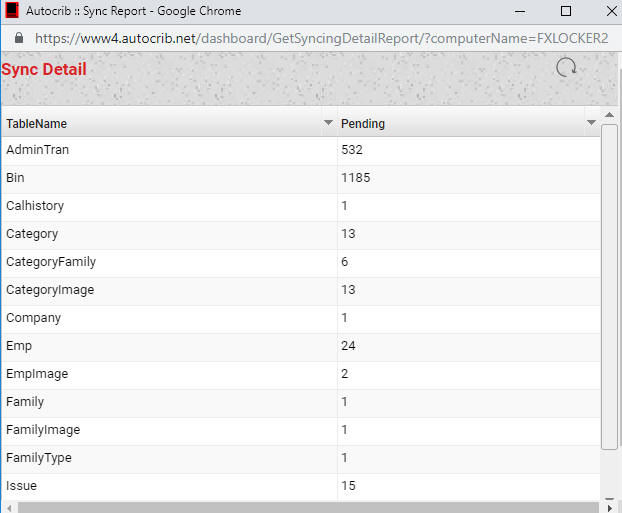
Click on a line to view additional sync details, the Sync Detail screen displays the Table Name and the number of Pending records for each table:
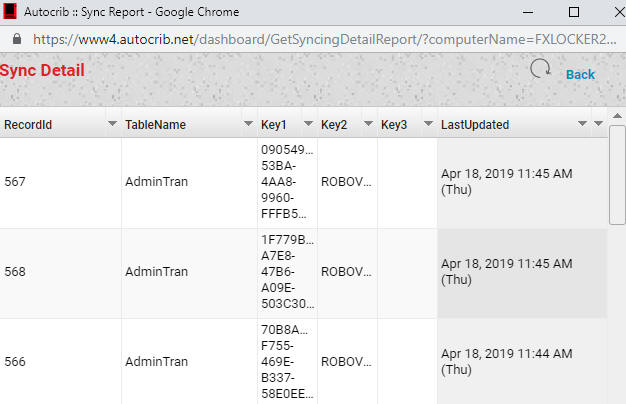
To view additional sync details for a specific table, click on the TableName you will then be able to see the Recordid, TableName, Key1, Key2, Key3, and LastUpdated date and time:
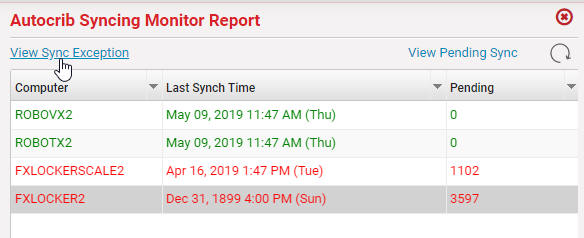
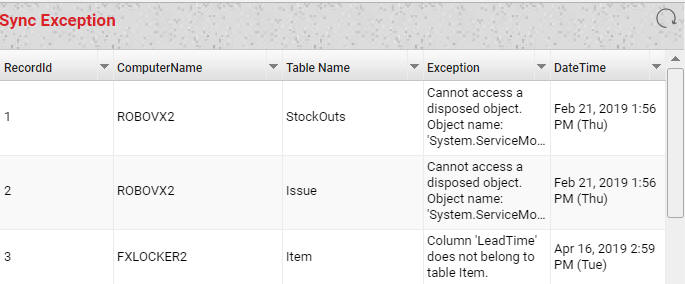
You may also select the View Sync Exception link from the Autocrib Syncing Monitor Report window:
The Sync Exception window will display the Recordid, ComputerName, TableName, Exception (reason for the failed sync for the record) and the DateTime the exception occured:


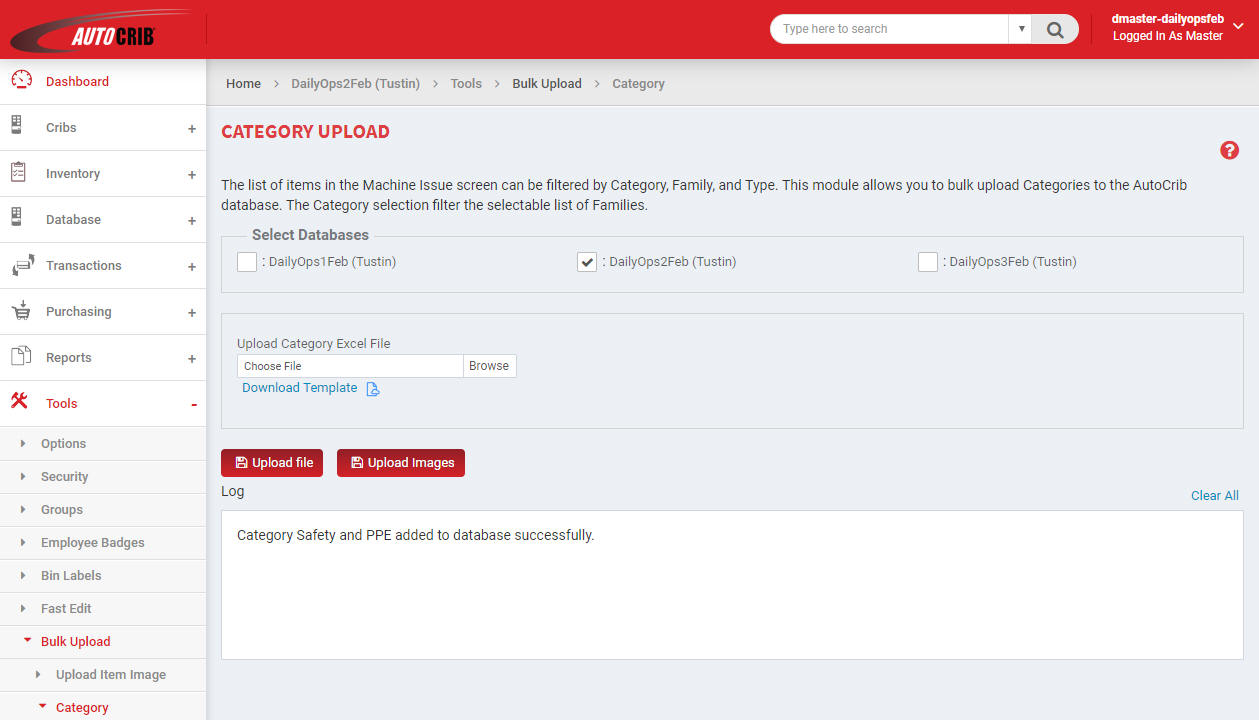
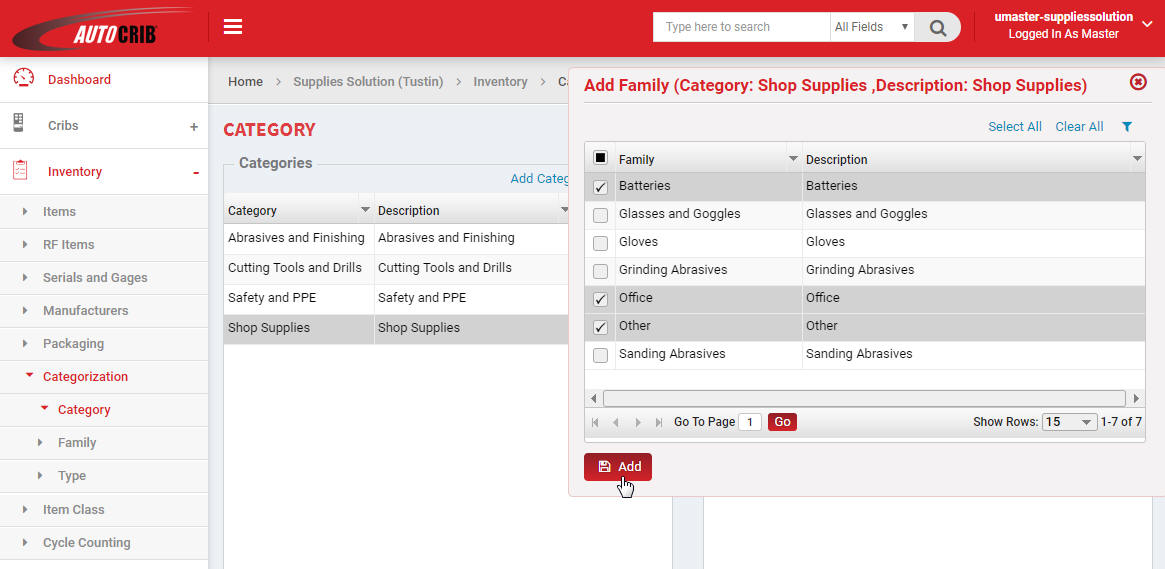
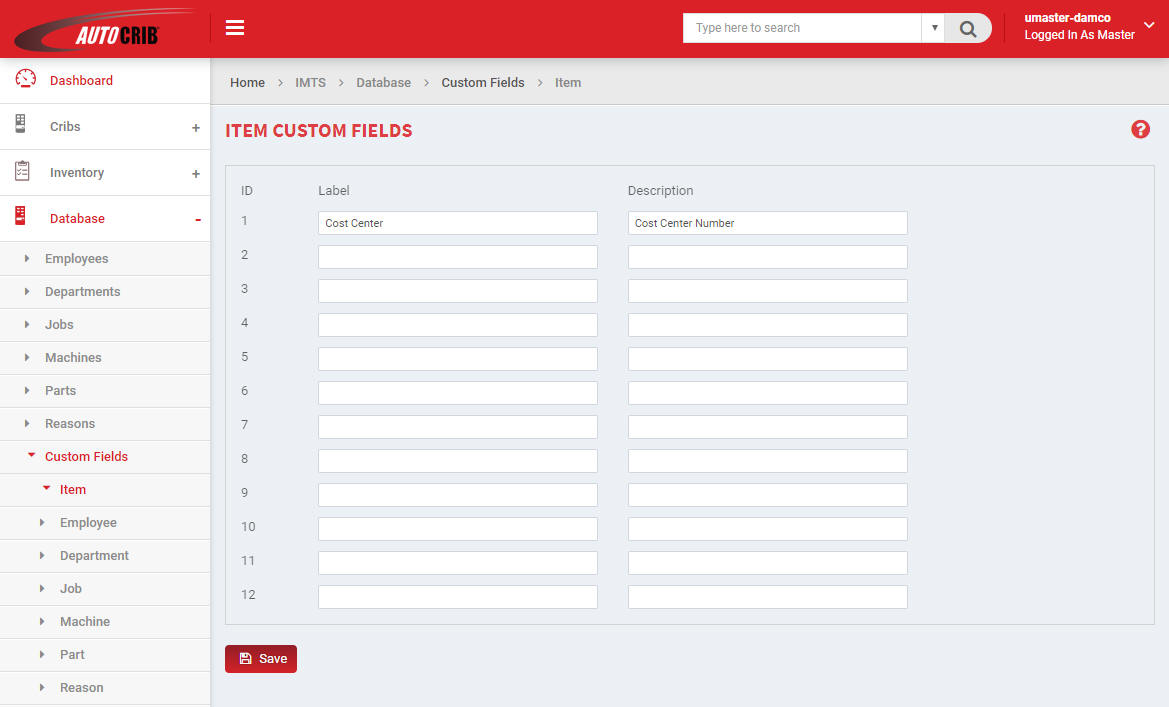
 , you will be directed
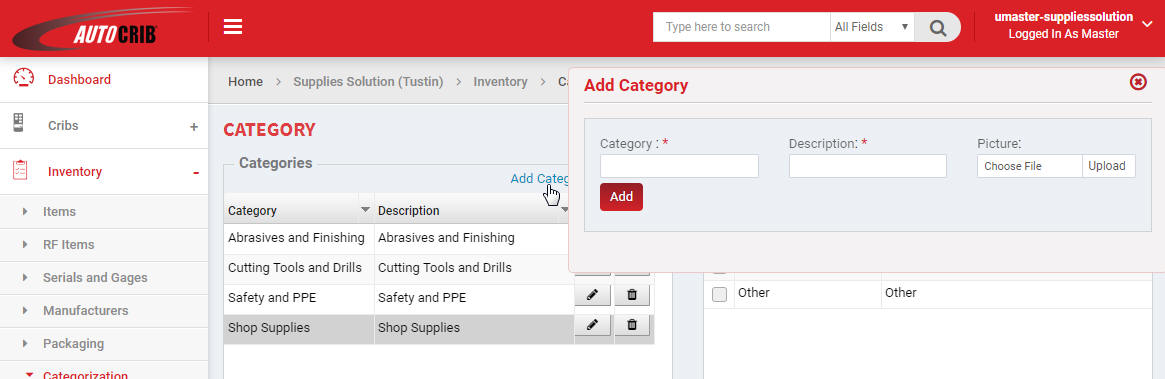
to the Edit Category screen. From the Edit Category
screen you may edit the Description or
Delete/Change the image, click the Save
button to save any changes.
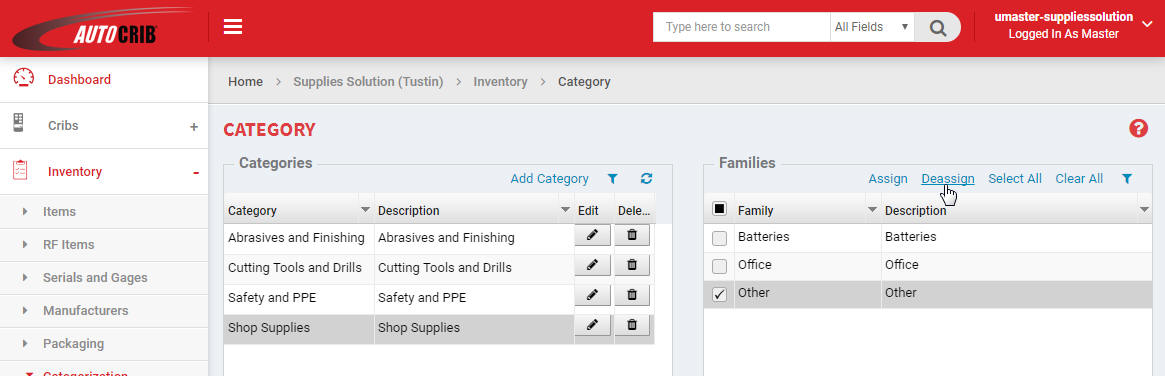
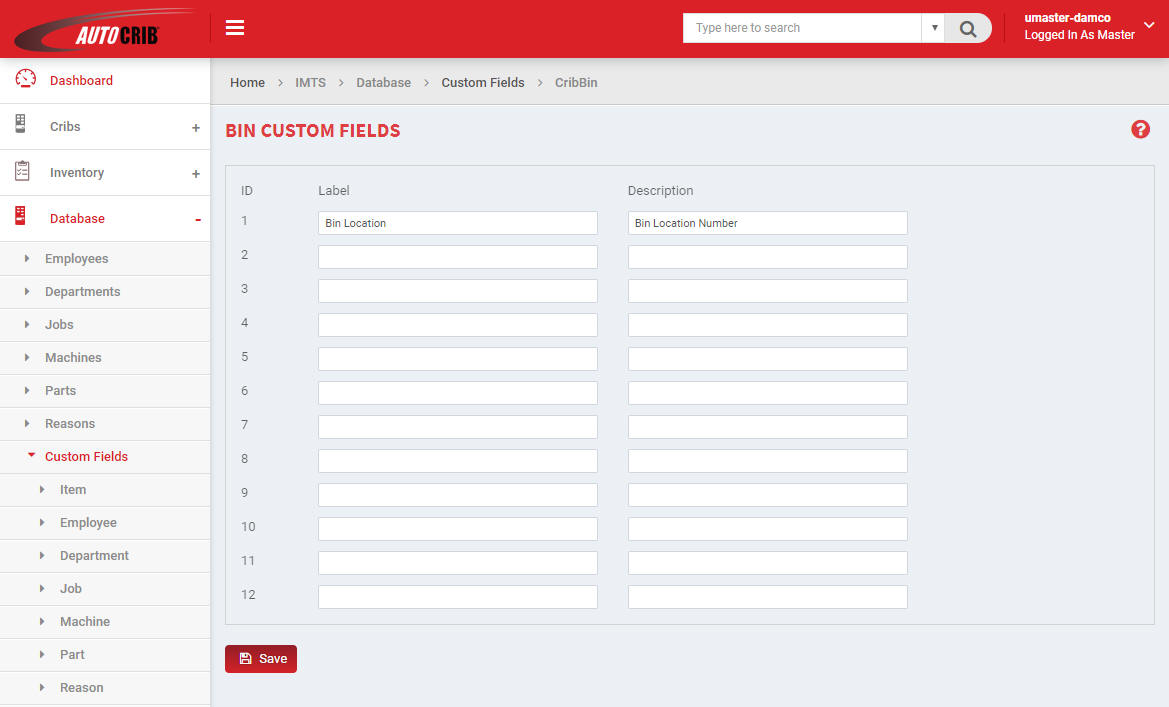
, you will be directed
to the Edit Category screen. From the Edit Category
screen you may edit the Description or
Delete/Change the image, click the Save
button to save any changes.  .
.


 .
. to view
the items monthly history of issues report.
to view
the items monthly history of issues report.